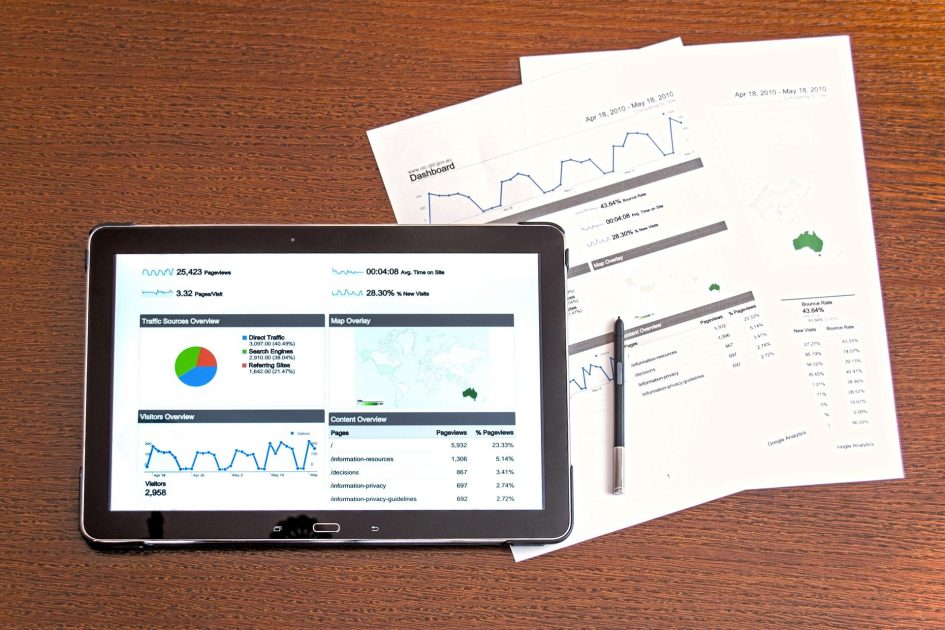
The year 2020 brought a drastic change in the course of the events. As the horror of the COVID-19 pandemic unraveled, the course of our lives totally changed. It affected the event industry globally. Many events were canceled, postponed. However, a major chunk brilliantly adapted virtual platforms for their events, along with physical events. They entered a new era, and most of them were major successes. Adaptability gave them a new life. However, the success measurement way of these events also changed. Fortunately, we have platforms that help you to assess the hybrid events. It can be effectually done through Event Analytics and KPIs.
What is Event Analytics?
Event Analytics is considered the next revolutionary aspect of event management. Event Analytics are soft wares powered by data. The purpose of event analytics is to provide us with valuable insights into event management. In addition, it allows us to assess an event based on specific metrics. It provides us with key data. Through this data, the success of any event can be measured through KPIs and metrics. These KPIs and metrics have been formulated over time as event management evolves. They have become the set standards on which an event is judged or contrasted to another event.

In addition, event analytics also help us to assess the social media strategies in event management. It is important to know that how people are interacting with your event site. Without this monitoring, we will not be able to know about the loopholes in the event’s online presence. Event analytics is a powerful tool that allows you to check the potential of your digital marketing efforts for the event.
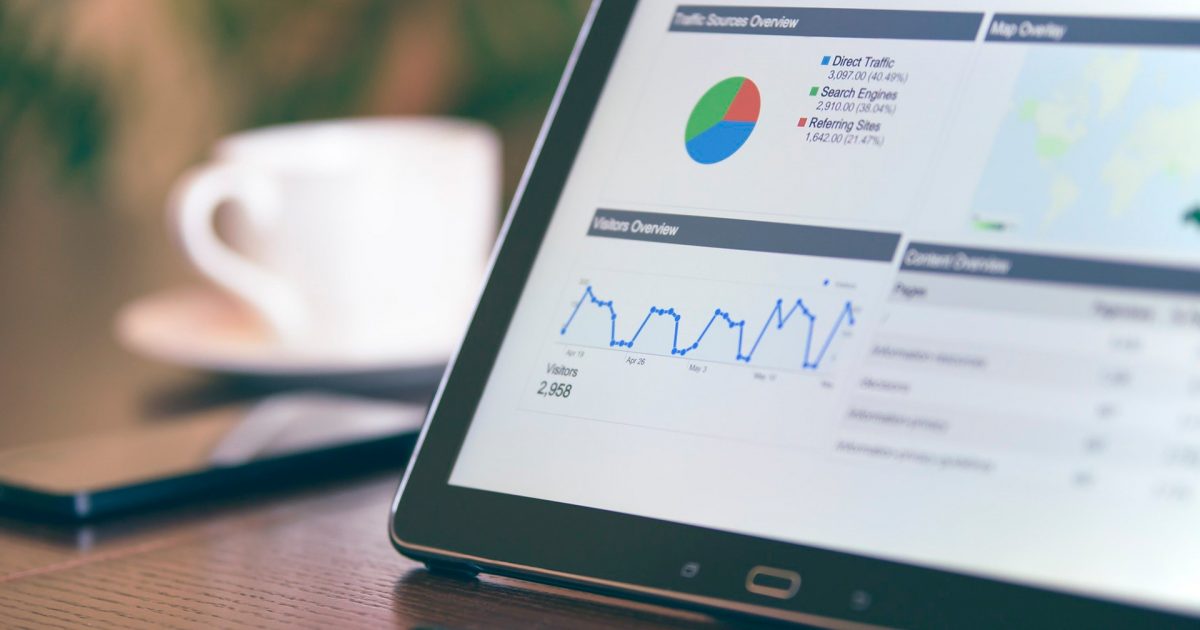
These event analytics soft wares can provide us with demographics about our site or event traffic. It would also specify the source of your visitors or registrations. The software would also tell about the most and least visited segment of your event site. It can provide real-time insights about traffic and registrations.
Having such kind of software and data is extremely valuable. These soft wares are easy to set up and manage your event’s online presence. The data can help you fix or modify the event according to the varying trends. Analytics software also keeps you updated about your competitors. It would help you make strategies that would set your event apart. Event analytics software would trace out the patterns or potential patterns of making an event a success. There are multiple event analytics software available. However, Google Analytics is the most celebrated one.
Essential Metrics to Assess an Event
Event Analytics soft wares are mechanisms full of wonders. They can provide you a whole lot of data about your event. The software has a plentiful of other options as well. However, the most important section is the section of metrics. Your event is evaluated based on these metrics. It is essential to have a key understanding of these metrics. They provide you with the right insights. Let us discuss them briefly below:
Acquisition
This section displays the sources of your visitors and registrations. You can see the exact number of visitors on your event page. Usually, an all-traffic tab provides you this data. The tab will specifically indicate the source as well. Like, it would tell that this specified segment of traffic came from advertisements. Other potential sources are a search engine, social media, referral, or any content of yours on another site. You can even see the number of people who came through email campaigns.
Now, you can observe all the data. You would be able to see that which channel or source brings the most traffic.
Behavior
This section in event analytics tells you about the nature of the interaction between your site and visitors. This section tells you about the whole journey of your visitor. It would take you into the details. It would tell you about how they entered your event site, their navigation until their exiting channel.
The behavior tab would also tell that how many visitors reached until registration. In addition, it would also tell you when and how many were abandoned at which moment. That is the level of details. It would also tell you about your least and most visited site.

Conversions
The word conversion in event analytics denotes a complete cycle. This indicates an entire process. A conversion is a complete cycle of a certain activity. This can be any purchase, registration, or downloads.
Audience
This section has all the data on your website. This section holds the key to the whole database. It tells about the number of visitors along with their navigation details. You can know about the data that is covered. It would also alert you about new users.
All these metrics set the strings of your hybrid event in the right and optimum direction. The data would help us to eradicate the loopholes as well.
KPIs to Measure Event Success
In addition, to the Event Analytics, KPIs are some into play of event success measurement. Key Performance indicators would help you to define or set the standards of a successful event. The event goals and desired comes are the best way to begin while looking into these KPIs. These KPIs would help you gauge the success whatever your goals may be. The event types also matter when it comes to deal with these KPIs. Let us now dive into the list of the top KPIs.
- Event Surveys: Event surveys are the best ways to swiftly check for attendee satisfaction. You can collect this survey before, after, or even during the event. The nature of responses would vary highly depending on the time of collection. However, whatever part or time they are collected, the responses are valuable. The feedback would allow you to create future events that surpass expectations. While designing the survey, be specific in your questions. You can provide comment boxes for elaboration as well. 91% of the marketers assess their events based on attendee satisfaction.
- Speaker Engagement: The audience can judge a speaker very quickly. In many cases, the speaker does not resonate with the audience. The presentation would not be considered a success. You can measure the success rate of all the speakers. You can enhance their success rate in many ways. The engagement rate can be elevated. Introduce some games, polls, or little talent shows. This would make the speaker stand out.
- Top Performing Topics: This also can be known initially in most cases. The engagement rate can tell a lot about any topic. The data collected and aggregated can help us to gain a better understanding of the topics.
- Social Media Mention: This is the most prevalent one on social media. Social media mentions denote the direct mention of social media handle. It is also commonly referred to as a shout-out as well. It can take the form of a relevant hashtag. Now, you need to make sure that your hashtag or event handle name is concise and easy to remember. Keep a detail of these mentions. Observe trends in these tracks.
- Customer Acquired: Now, after you are done taking the leads, it is now time to have a look at customers. You would need to measure the number of customers acquired. Make sure the customers are indeed acquired specifically due to the event. It is a must to identify the source of acquisition as well.
- A number of Active Community Members: Make sure to observe the number of most active attendees. This would also help you with managing the activity levels within the community as well. Data like this is beneficial. It enables you to find the rights ways to create massive engagement.
- Session Analytics: This involves evaluating each session deeply. The analytics will get you the feedback and session engagement ratings. You would be able to see how many attended virtually or how many in person. In addition, you would see view durations, page views, and a number of attendees.
- Gross Revenue: This metric is perceived as a dominant KPI in assessing an event’s impact or success. However, this factor is very vital when it comes to primary goals of revenue. The outcomes and differences between primary revenue goals and gross revenue tell a lot about event expectations. This KPI shows a lot about the demand for a particular event.
Conclusion
Remember, one thing about an event’s success. It is that measuring or assessing an event’s success is a personalized process. Event Analytics can help you with creating and optimizing your process. The KPIs would help you to understand that which metrics are more related to the desired outcome. Make sure you get the most out of these two methods. Both can help you in developing the underlying understanding of event success. Both of these would let you set the tone of the event accordingly.

